+353-1-416-8900REST OF WORLD
+44-20-3973-8888REST OF WORLD
1-917-300-0470EAST COAST U.S
1-800-526-8630U.S. (TOLL FREE)

Airborne LiDAR - Global Strategic Business Report

  • PDF Icon

    Report

  • 345 Pages
  • February 2025
  • Region: Global
  • Global Industry Analysts, Inc
  • ID: 4804466
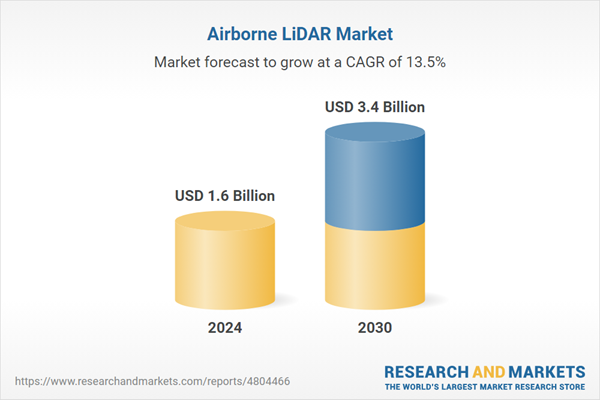
The global market for Airborne LiDAR was valued at US$1.6 Billion in 2024 and is projected to reach US$3.4 Billion by 2030, growing at a CAGR of 13.5% from 2024 to 2030. This comprehensive report provides an in-depth analysis of market trends, drivers, and forecasts, helping you make informed business decisions.

Global Airborne LiDAR Market - Key Trends and Drivers Summarized

How Does Airborne LiDAR Transform Mapping and Surveying?

Airborne LiDAR (Light Detection and Ranging) has revolutionized the fields of mapping and surveying by providing highly accurate and detailed three-dimensional representations of the Earth's surface. This technology uses laser pulses emitted from aircraft to measure distances to the ground, capturing precise data on topography, vegetation, and built structures. Unlike traditional surveying methods, airborne LiDAR can penetrate vegetation cover and collect data over vast areas in a relatively short time. This capability makes it invaluable for applications such as topographic mapping, forest inventory, and urban planning. The precision of LiDAR data allows for detailed analysis and modeling, which is crucial for infrastructure development, flood risk assessment, and natural resource management. The technology's ability to produce high-resolution digital elevation models (DEMs) and terrain maps has set new standards in accuracy and efficiency, making it a preferred tool for both governmental and private sector projects worldwide.

What Technological Advances Have Enhanced Airborne LiDAR Systems?

Recent technological advancements have significantly enhanced the performance and applicability of airborne LiDAR systems. Innovations in laser technology have led to the development of more compact, energy-efficient, and powerful LiDAR sensors. These sensors can capture higher resolution data at greater ranges, improving the quality and accuracy of the collected information. The integration of Global Navigation Satellite Systems (GNSS) and Inertial Measurement Units (IMUs) has also improved the precision of LiDAR systems by providing accurate positioning and orientation data. Furthermore, advancements in data processing software have enabled faster and more efficient handling of large datasets, facilitating real-time data analysis and visualization. The miniaturization of LiDAR systems has opened up new applications in smaller unmanned aerial vehicles (UAVs), making LiDAR accessible for a wider range of uses, including in areas that are difficult to access with traditional aircraft. These technological enhancements not only expand the capabilities of airborne LiDAR but also reduce the costs associated with data acquisition and processing, making it more accessible to various industries.

What Are the Key Applications and Market Challenges for Airborne LiDAR?

Airborne LiDAR has a wide range of applications across multiple industries, but it also faces several challenges. In urban planning and smart city development, LiDAR provides critical data for creating detailed 3D city models, helping planners design more efficient and resilient urban infrastructures. In environmental monitoring, LiDAR is used to map and analyze forests, wetlands, and coastal areas, providing data essential for conservation and resource management. The technology is also pivotal in disaster management, where it helps assess risks and guide emergency response planning. However, the high costs associated with LiDAR technology, including equipment, data processing, and skilled labor, can be a barrier to entry for smaller organizations. Additionally, the need for specialized training to operate and interpret LiDAR data poses another challenge. The large volumes of data generated by LiDAR surveys require significant storage and processing capabilities, which can be a logistical and financial burden. Despite these challenges, the benefits of accurate and high-resolution data continue to drive the adoption of LiDAR across various sectors.

What Drives the Growth in the Airborne LiDAR Market?

The growth in the airborne LiDAR market is driven by several factors, including technological advancements, expanding applications, and increasing demand for high-precision data. Technological innovations, such as more powerful sensors and improved data processing capabilities, have enhanced the efficiency and affordability of LiDAR systems. These advancements have opened new market opportunities, particularly in sectors like autonomous vehicles and UAVs, where precise environmental mapping is crucial. The expanding use of LiDAR in urban planning, infrastructure development, and environmental monitoring reflects a growing need for accurate and comprehensive data to support decision-making processes. Moreover, regulatory support for disaster management, environmental conservation, and smart city initiatives is propelling the demand for airborne LiDAR. As governments and private organizations seek to optimize resource management and mitigate risks, the adoption of LiDAR technology continues to rise. The increasing interest in real-time data analytics and the integration of LiDAR with other geospatial technologies, such as GIS, are also significant growth drivers. These factors collectively contribute to a robust and expanding market for airborne LiDAR, offering new opportunities for innovation and application in the coming years.

Report Scope

The report analyzes the Airborne LiDAR market, presented in terms of market value (US$ Thousand). The analysis covers the key segments and geographic regions outlined below.

Segments

Type (Topographic, Bathymetric); Platform (Fixed Wing Aircraft, Rotary Wing Aircraft, UAVs); Application (Corridor Mapping, Seismology, Exploration & Detection, Other Applications).

Geographic Regions/Countries

World; USA; Canada; Japan; China; Europe; France; Germany; Italy; UK; Spain; Russia; Rest of Europe; Asia-Pacific; Australia; India; South Korea; Rest of Asia-Pacific; Latin America; Argentina; Brazil; Mexico; Rest of Latin America; Middle East; Iran; Israel; Saudi Arabia; UAE; Rest of Middle East; Africa.

Key Insights:

  • Market Growth: Understand the significant growth trajectory of the Airborne Topographic LiDAR segment, which is expected to reach US$1.9 Billion by 2030 with a CAGR of a 13.2%. The Airborne Bathymetric LiDAR segment is also set to grow at 13.9% CAGR over the analysis period.
  • Regional Analysis: Gain insights into the U.S. market, valued at $426.1 Million in 2024, and China, forecasted to grow at an impressive 18.3% CAGR to reach $799.3 Million by 2030. Discover growth trends in other key regions, including Japan, Canada, Germany, and the Asia-Pacific.

Report Features:

  • Comprehensive Market Data: Independent analysis of annual sales and market forecasts in US$ Million from 2024 to 2030.
  • In-Depth Regional Analysis: Detailed insights into key markets, including the U.S., China, Japan, Canada, Europe, Asia-Pacific, Latin America, Middle East, and Africa.
  • Company Profiles: Coverage of major players such as Airborne Imagining Inc., Dibotics, FLIR Systems, Inc., Leica Geosystems AG, Merrick & Company, Inc. and more.
  • Complimentary Updates: Receive free report updates for one year to keep you informed of the latest market developments.

Why You Should Buy This Report:

  • Detailed Market Analysis: Access a thorough analysis of the Global Airborne LiDAR Market, covering all major geographic regions and market segments.
  • Competitive Insights: Get an overview of the competitive landscape, including the market presence of major players across different geographies.
  • Future Trends and Drivers: Understand the key trends and drivers shaping the future of the Global Airborne LiDAR Market.
  • Actionable Insights: Benefit from actionable insights that can help you identify new revenue opportunities and make strategic business decisions.

Key Questions Answered:

  • How is the Global Airborne LiDAR Market expected to evolve by 2030?
  • What are the main drivers and restraints affecting the market?
  • Which market segments will grow the most over the forecast period?
  • How will market shares for different regions and segments change by 2030?
  • Who are the leading players in the market, and what are their prospects?

Some of the 12 major companies featured in this Airborne LiDAR market report include:

  • Airborne Imagining Inc.
  • Dibotics
  • FLIR Systems, Inc.
  • Leica Geosystems AG
  • Merrick & Company, Inc.
  • SAAB AB
  • Teledyne Technologies Inc.
  • Velodyne Lidar, Inc.
  • Xactsense

Table of Contents

I. METHODOLOGYII. EXECUTIVE SUMMARY
1. MARKET OVERVIEW
  • Influencer Market Insights
  • Airborne LiDAR - Global Key Competitors Percentage Market Share in 2025 (E)
  • Competitive Market Presence - Strong/Active/Niche/Trivial for Players Worldwide in 2025 (E)
  • Global Economic Update
2. FOCUS ON SELECT PLAYERS
3. MARKET TRENDS & DRIVERS
  • Increasing Demand for High-Resolution Topographic Data Throws the Spotlight on Airborne LiDAR
  • Advancements in LiDAR Sensor Technology Propel Growth in Data Accuracy and Resolution
  • Rising Adoption in Autonomous Vehicles and Drones Expands Addressable Market Opportunity
  • Growing Use of Airborne LiDAR in Urban Planning and Smart Cities Strengthens Business Case for Adoption
  • Environmental Monitoring and Climate Change Studies Generate Demand for Precise Geospatial Data
  • Integration with Geographic Information Systems (GIS) Drives Adoption of Comprehensive Mapping Solutions
  • Increased Use in Forestry and Agriculture for Resource Management Spurs Growth
  • Growing Applications in Archeology and Cultural Heritage Conservation Fuel Market Growth
  • Expansion of the UAV Market and Its Role in Driving Airborne LiDAR Adoption
  • Evolving Security and Privacy Concerns Influence Market Dynamics and Regulatory Landscape
4. GLOBAL MARKET PERSPECTIVE
  • Table 1: World Recent Past, Current & Future Analysis for Topographic by Geographic Region - USA, Canada, Japan, China, Europe, Asia-Pacific, Latin America, Middle East and Africa Markets - Independent Analysis of Annual Sales in US$ Thousand for Years 2024 through 2030 and % CAGR
  • Table 2: World Historic Review for Topographic by Geographic Region - USA, Canada, Japan, China, Europe, Asia-Pacific, Latin America, Middle East and Africa Markets - Independent Analysis of Annual Sales in US$ Thousand for Years 2015 through 2023 and % CAGR
  • Table 3: World 15-Year Perspective for Topographic by Geographic Region - Percentage Breakdown of Value Sales for USA, Canada, Japan, China, Europe, Asia-Pacific, Latin America, Middle East and Africa for Years 2015, 2025 & 2030
  • Table 4: World Recent Past, Current & Future Analysis for Bathymetric by Geographic Region - USA, Canada, Japan, China, Europe, Asia-Pacific, Latin America, Middle East and Africa Markets - Independent Analysis of Annual Sales in US$ Thousand for Years 2024 through 2030 and % CAGR
  • Table 5: World Historic Review for Bathymetric by Geographic Region - USA, Canada, Japan, China, Europe, Asia-Pacific, Latin America, Middle East and Africa Markets - Independent Analysis of Annual Sales in US$ Thousand for Years 2015 through 2023 and % CAGR
  • Table 6: World 15-Year Perspective for Bathymetric by Geographic Region - Percentage Breakdown of Value Sales for USA, Canada, Japan, China, Europe, Asia-Pacific, Latin America, Middle East and Africa for Years 2015, 2025 & 2030
  • Table 7: World Recent Past, Current & Future Analysis for Fixed Wing Aircraft by Geographic Region - USA, Canada, Japan, China, Europe, Asia-Pacific, Latin America, Middle East and Africa Markets - Independent Analysis of Annual Sales in US$ Thousand for Years 2024 through 2030 and % CAGR
  • Table 8: World Historic Review for Fixed Wing Aircraft by Geographic Region - USA, Canada, Japan, China, Europe, Asia-Pacific, Latin America, Middle East and Africa Markets - Independent Analysis of Annual Sales in US$ Thousand for Years 2015 through 2023 and % CAGR
  • Table 9: World 15-Year Perspective for Fixed Wing Aircraft by Geographic Region - Percentage Breakdown of Value Sales for USA, Canada, Japan, China, Europe, Asia-Pacific, Latin America, Middle East and Africa for Years 2015, 2025 & 2030
  • Table 10: World Recent Past, Current & Future Analysis for Rotary Wing Aircraft by Geographic Region - USA, Canada, Japan, China, Europe, Asia-Pacific, Latin America, Middle East and Africa Markets - Independent Analysis of Annual Sales in US$ Thousand for Years 2024 through 2030 and % CAGR
  • Table 11: World Historic Review for Rotary Wing Aircraft by Geographic Region - USA, Canada, Japan, China, Europe, Asia-Pacific, Latin America, Middle East and Africa Markets - Independent Analysis of Annual Sales in US$ Thousand for Years 2015 through 2023 and % CAGR
  • Table 12: World 15-Year Perspective for Rotary Wing Aircraft by Geographic Region - Percentage Breakdown of Value Sales for USA, Canada, Japan, China, Europe, Asia-Pacific, Latin America, Middle East and Africa for Years 2015, 2025 & 2030
  • Table 13: World Recent Past, Current & Future Analysis for UAVs by Geographic Region - USA, Canada, Japan, China, Europe, Asia-Pacific, Latin America, Middle East and Africa Markets - Independent Analysis of Annual Sales in US$ Thousand for Years 2024 through 2030 and % CAGR
  • Table 14: World Historic Review for UAVs by Geographic Region - USA, Canada, Japan, China, Europe, Asia-Pacific, Latin America, Middle East and Africa Markets - Independent Analysis of Annual Sales in US$ Thousand for Years 2015 through 2023 and % CAGR
  • Table 15: World 15-Year Perspective for UAVs by Geographic Region - Percentage Breakdown of Value Sales for USA, Canada, Japan, China, Europe, Asia-Pacific, Latin America, Middle East and Africa for Years 2015, 2025 & 2030
  • Table 16: World Recent Past, Current & Future Analysis for Corridor Mapping by Geographic Region - USA, Canada, Japan, China, Europe, Asia-Pacific, Latin America, Middle East and Africa Markets - Independent Analysis of Annual Sales in US$ Thousand for Years 2024 through 2030 and % CAGR
  • Table 17: World Historic Review for Corridor Mapping by Geographic Region - USA, Canada, Japan, China, Europe, Asia-Pacific, Latin America, Middle East and Africa Markets - Independent Analysis of Annual Sales in US$ Thousand for Years 2015 through 2023 and % CAGR
  • Table 18: World 15-Year Perspective for Corridor Mapping by Geographic Region - Percentage Breakdown of Value Sales for USA, Canada, Japan, China, Europe, Asia-Pacific, Latin America, Middle East and Africa for Years 2015, 2025 & 2030
  • Table 19: World Recent Past, Current & Future Analysis for Seismology by Geographic Region - USA, Canada, Japan, China, Europe, Asia-Pacific, Latin America, Middle East and Africa Markets - Independent Analysis of Annual Sales in US$ Thousand for Years 2024 through 2030 and % CAGR
  • Table 20: World Historic Review for Seismology by Geographic Region - USA, Canada, Japan, China, Europe, Asia-Pacific, Latin America, Middle East and Africa Markets - Independent Analysis of Annual Sales in US$ Thousand for Years 2015 through 2023 and % CAGR
  • Table 21: World 15-Year Perspective for Seismology by Geographic Region - Percentage Breakdown of Value Sales for USA, Canada, Japan, China, Europe, Asia-Pacific, Latin America, Middle East and Africa for Years 2015, 2025 & 2030
  • Table 22: World Recent Past, Current & Future Analysis for Exploration & Detection by Geographic Region - USA, Canada, Japan, China, Europe, Asia-Pacific, Latin America, Middle East and Africa Markets - Independent Analysis of Annual Sales in US$ Thousand for Years 2024 through 2030 and % CAGR
  • Table 23: World Historic Review for Exploration & Detection by Geographic Region - USA, Canada, Japan, China, Europe, Asia-Pacific, Latin America, Middle East and Africa Markets - Independent Analysis of Annual Sales in US$ Thousand for Years 2015 through 2023 and % CAGR
  • Table 24: World 15-Year Perspective for Exploration & Detection by Geographic Region - Percentage Breakdown of Value Sales for USA, Canada, Japan, China, Europe, Asia-Pacific, Latin America, Middle East and Africa for Years 2015, 2025 & 2030
  • Table 25: World Recent Past, Current & Future Analysis for Other Applications by Geographic Region - USA, Canada, Japan, China, Europe, Asia-Pacific, Latin America, Middle East and Africa Markets - Independent Analysis of Annual Sales in US$ Thousand for Years 2024 through 2030 and % CAGR
  • Table 26: World Historic Review for Other Applications by Geographic Region - USA, Canada, Japan, China, Europe, Asia-Pacific, Latin America, Middle East and Africa Markets - Independent Analysis of Annual Sales in US$ Thousand for Years 2015 through 2023 and % CAGR
  • Table 27: World 15-Year Perspective for Other Applications by Geographic Region - Percentage Breakdown of Value Sales for USA, Canada, Japan, China, Europe, Asia-Pacific, Latin America, Middle East and Africa for Years 2015, 2025 & 2030
  • Table 28: World Airborne LiDAR Market Analysis of Annual Sales in US$ Thousand for Years 2015 through 2030
  • Table 29: World Recent Past, Current & Future Analysis for Airborne LiDAR by Geographic Region - USA, Canada, Japan, China, Europe, Asia-Pacific, Latin America, Middle East and Africa Markets - Independent Analysis of Annual Sales in US$ Thousand for Years 2024 through 2030 and % CAGR
  • Table 30: World Historic Review for Airborne LiDAR by Geographic Region - USA, Canada, Japan, China, Europe, Asia-Pacific, Latin America, Middle East and Africa Markets - Independent Analysis of Annual Sales in US$ Thousand for Years 2015 through 2023 and % CAGR
  • Table 31: World 15-Year Perspective for Airborne LiDAR by Geographic Region - Percentage Breakdown of Value Sales for USA, Canada, Japan, China, Europe, Asia-Pacific, Latin America, Middle East and Africa Markets for Years 2015, 2025 & 2030
III. MARKET ANALYSIS
UNITED STATES
  • Airborne LiDAR Market Presence - Strong/Active/Niche/Trivial - Key Competitors in the United States for 2025 (E)
CANADA
JAPAN
  • Airborne LiDAR Market Presence - Strong/Active/Niche/Trivial - Key Competitors in Japan for 2025 (E)
CHINA
  • Airborne LiDAR Market Presence - Strong/Active/Niche/Trivial - Key Competitors in China for 2025 (E)
EUROPE
  • Airborne LiDAR Market Presence - Strong/Active/Niche/Trivial - Key Competitors in Europe for 2025 (E)
FRANCE
  • Airborne LiDAR Market Presence - Strong/Active/Niche/Trivial - Key Competitors in France for 2025 (E)
GERMANY
  • Airborne LiDAR Market Presence - Strong/Active/Niche/Trivial - Key Competitors in Germany for 2025 (E)
ITALY
UNITED KINGDOM
  • Airborne LiDAR Market Presence - Strong/Active/Niche/Trivial - Key Competitors in the United Kingdom for 2025 (E)
SPAINRUSSIAREST OF EUROPE
ASIA-PACIFIC
  • Airborne LiDAR Market Presence - Strong/Active/Niche/Trivial - Key Competitors in Asia-Pacific for 2025 (E)
AUSTRALIA
  • Airborne LiDAR Market Presence - Strong/Active/Niche/Trivial - Key Competitors in Australia for 2025 (E)
INDIA
  • Airborne LiDAR Market Presence - Strong/Active/Niche/Trivial - Key Competitors in India for 2025 (E)
SOUTH KOREAREST OF ASIA-PACIFIC
LATIN AMERICA
  • Airborne LiDAR Market Presence - Strong/Active/Niche/Trivial - Key Competitors in Latin America for 2025 (E)
ARGENTINABRAZILMEXICOREST OF LATIN AMERICA
MIDDLE EAST
  • Airborne LiDAR Market Presence - Strong/Active/Niche/Trivial - Key Competitors in Middle East for 2025 (E)
IRANISRAELSAUDI ARABIAUNITED ARAB EMIRATESREST OF MIDDLE EAST
AFRICA
  • Airborne LiDAR Market Presence - Strong/Active/Niche/Trivial - Key Competitors in Africa for 2025 (E)
IV. COMPETITION

Companies Mentioned (Partial List)

A selection of companies mentioned in this report includes, but is not limited to:

  • Airborne Imagining Inc.
  • Dibotics
  • FLIR Systems, Inc.
  • Leica Geosystems AG
  • Merrick & Company, Inc.
  • SAAB AB
  • Teledyne Technologies Inc.
  • Velodyne Lidar, Inc.
  • Xactsense

Table Information