+353-1-416-8900REST OF WORLD
+44-20-3973-8888REST OF WORLD
1-917-300-0470EAST COAST U.S
1-800-526-8630U.S. (TOLL FREE)

Aerial Imaging - Global Strategic Business Report

  • PDF Icon

    Report

  • 389 Pages
  • February 2025
  • Region: Global
  • Global Industry Analysts, Inc
  • ID: 4804509
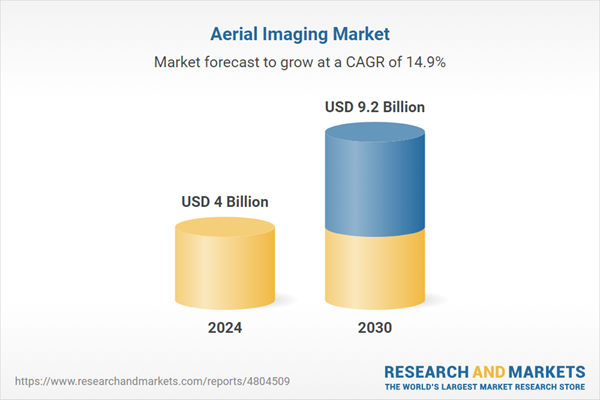
The global market for Aerial Imaging was valued at US$4.0 Billion in 2024 and is projected to reach US$9.1 Billion by 2030, growing at a CAGR of 14.8% from 2024 to 2030. This comprehensive report provides an in-depth analysis of market trends, drivers, and forecasts, helping you make informed business decisions.

Global Aerial Imaging Market - Key Trends & Drivers Summarized

What Exactly Is Aerial Imaging?

Aerial imaging encompasses the methods and technologies used to capture photographs of the ground from an elevated position. Typically, the camera is not supported by a ground-based structure, and platforms for such photography include fixed-wing aircraft, helicopters, unmanned aerial vehicles (UAVs), balloons, blimps and dirigibles, rockets, kites, parachutes, and vehicle-mounted poles. The images obtained are used for various purposes including mapping, surveillance, environmental monitoring, and urban planning, among others. These images provide valuable data for agricultural, forestry, and land management applications, as well as for emergency response, and disaster relief, offering a unique perspective that ground-based photography cannot achieve.

How Has Technology Advanced Aerial Imaging?

Technological advancements have significantly shaped the aerial imaging industry. High-resolution cameras, sophisticated remote sensing technology, and enhanced UAV capabilities have dramatically increased the quality and scope of imagery that can be captured. Modern drones, equipped with advanced stabilization and imaging technologies, can capture detailed photographs and videos even in adverse weather conditions, making aerial imaging more versatile and accessible. Additionally, integration with cloud computing and AI technologies enables real-time data processing and analysis, making aerial imaging a powerful tool for real-time decision making in fields such as agriculture for monitoring crop health and urban development for traffic management.

What Are the Major Applications of Aerial Imaging?

Aerial imaging serves a broad spectrum of applications across various sectors. In urban planning, it helps in the detailed mapping of large urban areas to plan residential expansions, road networks, and public utilities. Environmental monitoring is another significant application; aerial images are crucial for tracking changes in natural habitats, monitoring wildlife populations, and assessing the impacts of climate change such as glacier retreat and changes in sea levels. In agriculture, aerial imaging is used extensively to monitor crop health, optimize water use, and manage resources more efficiently through precision agriculture techniques. Furthermore, in disaster management, aerial imaging plays a crucial role by providing accurate and timely data that helps in effective planning and response strategies during natural disasters such as floods, earthquakes, and hurricanes.

What Are the Growth Drivers for the Aerial Imaging Market?

The growth in the aerial imaging market is driven by several factors, notably the advancements in drone technology and the increasing affordability of drone and imaging technologies. These technological improvements have expanded the accessibility and usability of aerial imaging across a wide range of industries. In addition, there's a rising demand for up-to-date geographic information system (GIS) datasets for urban planning and land management, which aerial imaging supplies with great efficiency. The growing prevalence of location-based services among consumers who require real-time and accurate geographical data further stimulates market expansion. Lastly, regulatory support and the easing of restrictions on the use of drones in many countries have allowed the aerial imaging industry to flourish, making aerial imaging tools indispensable for modern mapping, planning, and management tasks.

Scope of the Study

The report analyzes the Aerial Imaging market, presented in terms of market value (US$ Thousand). The analysis covers the key segments and geographic regions outlined below.

Segments:

Platform (UAV & Drone, Fixed Wing Aircraft, Helicopter, Other Platforms); Application (Geospatial Mapping, Surveillance & Monitoring, Disaster Management, Energy & Resource Management, Urban Planning, Other Applications); End-Use (Government, Agriculture & Forestry, Civil Engineering, Energy, Military & Defense, Media & Entertainment, Other End-Uses).

Geographic Regions/Countries:

World; USA; Canada; Japan; China; Europe; France; Germany; Italy; UK; Rest of Europe; Asia-Pacific; Rest of World.

Key Insights:

  • Market Growth: Understand the significant growth trajectory of the UAV & Drone Platform segment, which is expected to reach US$5.2 Billion by 2030 with a CAGR of a 16.1%. The Fixed Wing Aircraft Platform segment is also set to grow at 14.5% CAGR over the analysis period.
  • Regional Analysis: Gain insights into the U.S. market, valued at $1.1 Billion in 2024, and China, forecasted to grow at an impressive 16.9% CAGR to reach $1.4 Billion by 2030. Discover growth trends in other key regions, including Japan, Canada, Germany, and the Asia-Pacific.

Report Features:

  • Comprehensive Market Data: Independent analysis of annual sales and market forecasts in US$ Million from 2024 to 2030.
  • In-Depth Regional Analysis: Detailed insights into key markets, including the U.S., China, Japan, Canada, Europe, Asia-Pacific, Latin America, Middle East, and Africa.
  • Company Profiles: Coverage of major players such as AeroVironment, Inc., 3D Robotics, Inc. (3DR), Altispire, CYBERHAWK Innovations Ltd., DroneDeploy and more.
  • Complimentary Updates: Receive free report updates for one year to keep you informed of the latest market developments.

Why You Should Buy This Report:

  • Detailed Market Analysis: Access a thorough analysis of the Global Aerial Imaging Market, covering all major geographic regions and market segments.
  • Competitive Insights: Get an overview of the competitive landscape, including the market presence of major players across different geographies.
  • Future Trends and Drivers: Understand the key trends and drivers shaping the future of the Global Aerial Imaging Market.
  • Actionable Insights: Benefit from actionable insights that can help you identify new revenue opportunities and make strategic business decisions.

Key Questions Answered:

  • How is the Global Aerial Imaging Market expected to evolve by 2030?
  • What are the main drivers and restraints affecting the market?
  • Which market segments will grow the most over the forecast period?
  • How will market shares for different regions and segments change by 2030?
  • Who are the leading players in the market, and what are their prospects?

Some of the 74 major companies featured in this Aerial Imaging market report include:

  • AeroVironment, Inc.
  • 3D Robotics, Inc. (3DR)
  • Altispire
  • CYBERHAWK Innovations Ltd.
  • DroneDeploy
  • Fugro NV
  • Bluesky International Ltd.
  • DroneView Technologies
  • Datumate Ltd.
  • FlyWorx - Aerial Drone Services
  • AEROmetrex
  • Ceres Imaging
  • Drone Aerial Imaging
  • GroundTruth Exploration Inc.
  • Airobotics Ltd.

Table of Contents

I. METHODOLOGYMII. EXECUTIVE SUMMARY
1. MARKET OVERVIEW
  • Influencer Market Insights
  • World Market Trajectories
  • Aerial Imaging - Global Key Competitors Percentage Market Share in 2024 (E)
  • Competitive Market Presence - Strong/Active/Niche/Trivial for Players Worldwide in 2024 (E)
  • Aerial Imaging: A Prelude
  • Market Outlook
  • Key Challenges
  • North America Remains Frontrunner in Global Aerial Imaging Market
  • Aerial Imaging Technology Witnesses Major Leap Forward with Drones
  • Aerial & Satellite Imagery: Primary Merits & Limitations
  • Factors Influencing Selection of Aerial & Satellite Imagery
  • Recent Market Activity
2. FOCUS ON SELECT PLAYERS
3. MARKET TRENDS & DRIVERS
  • Rising Investments in Startups
  • Surveying & Mapping Industry Observes Paradigm Shift towards Aerial Imaging
  • Aerial Photogrammetry for Mapping Applications
  • Drones for Surveying & Mapping Workflows
  • The Growing Need to Manage Disaster Risk Against the Backdrop of Climate Change Drives Demand for Aerial Imaging
  • Aerial Imagery Helps Better Preparedness in Event of Natural Catastrophes
  • Growing Frequency of Extreme Weather Events & Related Losses Drives the Focus on Disaster Preparedness: Global Number of Extreme Weather Events & Financial Losses (In US$ Billion) for the Years 2000, 2005, 2010, 2015 and 2020
  • Addressing Gaps with Remote Sensing
  • Environmental Monitoring & Wildlife Conservation: Growing Application Areas
  • Aerial Imaging Presents Holistic Mapping Solution for Diverse Industries
  • Unprecedented Catastrophes Make Insurers to Bet on Aerial Imaging to Analyze Effect of Natural Disasters
  • Drone Usage for Aerial Imaging Gains Traction in Insurance Industry
  • Aerial Imaging to Help Scientists Estimate River Discharge
  • Expanding Population and Rising Demand for Food Fuel Adoption of Agricultural Aerial Imaging Systems
  • Startups from across the World Developing Innovative Aerial Imaging Solutions for the field of Agriculture
  • World Arable Land (in Million Ha): 1961-2050
  • Labor Shortage in Agriculture to Drive Increased Uptake of Aerial Imaging
  • EXHBIT: Percentage (%) of Agricultural Workers in the Global Workforce for the Years 1992, 2019 & 2022
  • Growing Attention Towards Precision Farming Benefits Uptake
  • Companies Gear Up to Tap Agricultural Drone Demand for Field Mapping Application
  • Agricultural Drones Powered by Multispectral Imaging Transform Farming Practices
  • Real Estate Industry Leverages Aerial Imaging Technology
  • Aerial Imagery Becomes More Meaningful With AI and DL for Land Surveying and Civil Engineering Enterprises
  • Factors Set to Favor and Positively Influence Drone-based Aerial Imaging
  • Key Challenges
  • Global Drone Enabled Service Revenues by Application in Percentage: 2025P
  • An Insight into Technological Advancements in Aerial Imaging
  • Drone Cameras Get Smarter
  • 3D Aerial Modeling with Drones
  • 360° VR Drone Cameras
  • Vertical Drone Cameras
  • Advances Related to Software, Sensors and AI
  • Aerial Imaging to Embrace AI
  • Surveying and Mapping Services find Significance for Smart City Initiatives
  • Smart City Spending in US$ Billion for Years 2020 and 2027
  • Aerial Imagery for Border Enforcement & Migration Surveillance
  • Defense Expenditure Worldwide in US$ Billion for the Years 2001 through 2023
  • Protection of Critical Infrastructure Drives Adoption of Aerial Imaging in Energy & Utilities Industry
  • Projected Infrastructure Investments in the Energy Sector Sets the Business Climate for Aerial Imaging in Utilities: Global Cumulative Infrastructure Spending (In US$ Trillion) by Sector during 2016-2030
  • Aerial Imaging Brims with Huge Potential for Efficient Deployment of Solar Projects
  • Aerial Photography for Different Phases of Solar Projects
  • Oil & Gas Industry: Aerial imaging Helps Surveillance of Critical Assets and Remote Sites
4. GLOBAL MARKET PERSPECTIVE
  • TABLE 1: World Recent Past, Current & Future Analysis for Aerial Imaging by Geographic Region - USA, Canada, Japan, China, Europe, Asia-Pacific and Rest of World Markets - Independent Analysis of Annual Revenues in US$ Thousand for Years 2024 through 2030 and % CAGR
  • TABLE 2: World Historic Review for Aerial Imaging by Geographic Region - USA, Canada, Japan, China, Europe, Asia-Pacific and Rest of World Markets - Independent Analysis of Annual Revenues in US$ Thousand for Years 2015 through 2023 and % CAGR
  • TABLE 3: World 15-Year Perspective for Aerial Imaging by Geographic Region - Percentage Breakdown of Value Revenues for USA, Canada, Japan, China, Europe, Asia-Pacific and Rest of World Markets for Years 2015, 2025 & 2030
  • TABLE 4: World Recent Past, Current & Future Analysis for UAV & Drone by Geographic Region - USA, Canada, Japan, China, Europe, Asia-Pacific and Rest of World Markets - Independent Analysis of Annual Revenues in US$ Thousand for Years 2024 through 2030 and % CAGR
  • TABLE 5: World Historic Review for UAV & Drone by Geographic Region - USA, Canada, Japan, China, Europe, Asia-Pacific and Rest of World Markets - Independent Analysis of Annual Revenues in US$ Thousand for Years 2015 through 2023 and % CAGR
  • TABLE 6: World 15-Year Perspective for UAV & Drone by Geographic Region - Percentage Breakdown of Value Revenues for USA, Canada, Japan, China, Europe, Asia-Pacific and Rest of World for Years 2015, 2025 & 2030
  • TABLE 7: World Recent Past, Current & Future Analysis for Fixed Wing Aircraft by Geographic Region - USA, Canada, Japan, China, Europe, Asia-Pacific and Rest of World Markets - Independent Analysis of Annual Revenues in US$ Thousand for Years 2024 through 2030 and % CAGR
  • TABLE 8: World Historic Review for Fixed Wing Aircraft by Geographic Region - USA, Canada, Japan, China, Europe, Asia-Pacific and Rest of World Markets - Independent Analysis of Annual Revenues in US$ Thousand for Years 2015 through 2023 and % CAGR
  • TABLE 9: World 15-Year Perspective for Fixed Wing Aircraft by Geographic Region - Percentage Breakdown of Value Revenues for USA, Canada, Japan, China, Europe, Asia-Pacific and Rest of World for Years 2015, 2025 & 2030
  • TABLE 10: World Recent Past, Current & Future Analysis for Helicopter by Geographic Region - USA, Canada, Japan, China, Europe, Asia-Pacific and Rest of World Markets - Independent Analysis of Annual Revenues in US$ Thousand for Years 2024 through 2030 and % CAGR
  • TABLE 11: World Historic Review for Helicopter by Geographic Region - USA, Canada, Japan, China, Europe, Asia-Pacific and Rest of World Markets - Independent Analysis of Annual Revenues in US$ Thousand for Years 2015 through 2023 and % CAGR
  • TABLE 12: World 15-Year Perspective for Helicopter by Geographic Region - Percentage Breakdown of Value Revenues for USA, Canada, Japan, China, Europe, Asia-Pacific and Rest of World for Years 2015, 2025 & 2030
  • TABLE 13: World Recent Past, Current & Future Analysis for Other Platforms by Geographic Region - USA, Canada, Japan, China, Europe, Asia-Pacific and Rest of World Markets - Independent Analysis of Annual Revenues in US$ Thousand for Years 2024 through 2030 and % CAGR
  • TABLE 14: World Historic Review for Other Platforms by Geographic Region - USA, Canada, Japan, China, Europe, Asia-Pacific and Rest of World Markets - Independent Analysis of Annual Revenues in US$ Thousand for Years 2015 through 2023 and % CAGR
  • TABLE 15: World 15-Year Perspective for Other Platforms by Geographic Region - Percentage Breakdown of Value Revenues for USA, Canada, Japan, China, Europe, Asia-Pacific and Rest of World for Years 2015, 2025 & 2030
  • TABLE 16: World Recent Past, Current & Future Analysis for Geospatial Mapping by Geographic Region - USA, Canada, Japan, China, Europe, Asia-Pacific and Rest of World Markets - Independent Analysis of Annual Revenues in US$ Thousand for Years 2024 through 2030 and % CAGR
  • TABLE 17: World Historic Review for Geospatial Mapping by Geographic Region - USA, Canada, Japan, China, Europe, Asia-Pacific and Rest of World Markets - Independent Analysis of Annual Revenues in US$ Thousand for Years 2015 through 2023 and % CAGR
  • TABLE 18: World 15-Year Perspective for Geospatial Mapping by Geographic Region - Percentage Breakdown of Value Revenues for USA, Canada, Japan, China, Europe, Asia-Pacific and Rest of World for Years 2015, 2025 & 2030
  • TABLE 19: World Recent Past, Current & Future Analysis for Surveillance & Monitoring by Geographic Region - USA, Canada, Japan, China, Europe, Asia-Pacific and Rest of World Markets - Independent Analysis of Annual Revenues in US$ Thousand for Years 2024 through 2030 and % CAGR
  • TABLE 20: World Historic Review for Surveillance & Monitoring by Geographic Region - USA, Canada, Japan, China, Europe, Asia-Pacific and Rest of World Markets - Independent Analysis of Annual Revenues in US$ Thousand for Years 2015 through 2023 and % CAGR
  • TABLE 21: World 15-Year Perspective for Surveillance & Monitoring by Geographic Region - Percentage Breakdown of Value Revenues for USA, Canada, Japan, China, Europe, Asia-Pacific and Rest of World for Years 2015, 2025 & 2030
  • TABLE 22: World Recent Past, Current & Future Analysis for Disaster Management by Geographic Region - USA, Canada, Japan, China, Europe, Asia-Pacific and Rest of World Markets - Independent Analysis of Annual Revenues in US$ Thousand for Years 2024 through 2030 and % CAGR
  • TABLE 23: World Historic Review for Disaster Management by Geographic Region - USA, Canada, Japan, China, Europe, Asia-Pacific and Rest of World Markets - Independent Analysis of Annual Revenues in US$ Thousand for Years 2015 through 2023 and % CAGR
  • TABLE 24: World 15-Year Perspective for Disaster Management by Geographic Region - Percentage Breakdown of Value Revenues for USA, Canada, Japan, China, Europe, Asia-Pacific and Rest of World for Years 2015, 2025 & 2030
  • TABLE 25: World Recent Past, Current & Future Analysis for Energy & Resource Management by Geographic Region - USA, Canada, Japan, China, Europe, Asia-Pacific and Rest of World Markets - Independent Analysis of Annual Revenues in US$ Thousand for Years 2024 through 2030 and % CAGR
  • TABLE 26: World Historic Review for Energy & Resource Management by Geographic Region - USA, Canada, Japan, China, Europe, Asia-Pacific and Rest of World Markets - Independent Analysis of Annual Revenues in US$ Thousand for Years 2015 through 2023 and % CAGR
  • TABLE 27: World 15-Year Perspective for Energy & Resource Management by Geographic Region - Percentage Breakdown of Value Revenues for USA, Canada, Japan, China, Europe, Asia-Pacific and Rest of World for Years 2015, 2025 & 2030
  • TABLE 28: World Recent Past, Current & Future Analysis for Urban Planning by Geographic Region - USA, Canada, Japan, China, Europe, Asia-Pacific and Rest of World Markets - Independent Analysis of Annual Revenues in US$ Thousand for Years 2024 through 2030 and % CAGR
  • TABLE 29: World Historic Review for Urban Planning by Geographic Region - USA, Canada, Japan, China, Europe, Asia-Pacific and Rest of World Markets - Independent Analysis of Annual Revenues in US$ Thousand for Years 2015 through 2023 and % CAGR
  • TABLE 30: World 15-Year Perspective for Urban Planning by Geographic Region - Percentage Breakdown of Value Revenues for USA, Canada, Japan, China, Europe, Asia-Pacific and Rest of World for Years 2015, 2025 & 2030
  • TABLE 31: World Recent Past, Current & Future Analysis for Other Applications by Geographic Region - USA, Canada, Japan, China, Europe, Asia-Pacific and Rest of World Markets - Independent Analysis of Annual Revenues in US$ Thousand for Years 2024 through 2030 and % CAGR
  • TABLE 32: World Historic Review for Other Applications by Geographic Region - USA, Canada, Japan, China, Europe, Asia-Pacific and Rest of World Markets - Independent Analysis of Annual Revenues in US$ Thousand for Years 2015 through 2023 and % CAGR
  • TABLE 33: World 15-Year Perspective for Other Applications by Geographic Region - Percentage Breakdown of Value Revenues for USA, Canada, Japan, China, Europe, Asia-Pacific and Rest of World for Years 2015, 2025 & 2030
  • TABLE 34: World Recent Past, Current & Future Analysis for Government by Geographic Region - USA, Canada, Japan, China, Europe, Asia-Pacific and Rest of World Markets - Independent Analysis of Annual Revenues in US$ Thousand for Years 2024 through 2030 and % CAGR
  • TABLE 35: World Historic Review for Government by Geographic Region - USA, Canada, Japan, China, Europe, Asia-Pacific and Rest of World Markets - Independent Analysis of Annual Revenues in US$ Thousand for Years 2015 through 2023 and % CAGR
  • TABLE 36: World 15-Year Perspective for Government by Geographic Region - Percentage Breakdown of Value Revenues for USA, Canada, Japan, China, Europe, Asia-Pacific and Rest of World for Years 2015, 2025 & 2030
  • TABLE 37: World Recent Past, Current & Future Analysis for Agriculture & Forestry by Geographic Region - USA, Canada, Japan, China, Europe, Asia-Pacific and Rest of World Markets - Independent Analysis of Annual Revenues in US$ Thousand for Years 2024 through 2030 and % CAGR
  • TABLE 38: World Historic Review for Agriculture & Forestry by Geographic Region - USA, Canada, Japan, China, Europe, Asia-Pacific and Rest of World Markets - Independent Analysis of Annual Revenues in US$ Thousand for Years 2015 through 2023 and % CAGR
  • TABLE 39: World 15-Year Perspective for Agriculture & Forestry by Geographic Region - Percentage Breakdown of Value Revenues for USA, Canada, Japan, China, Europe, Asia-Pacific and Rest of World for Years 2015, 2025 & 2030
  • TABLE 40: World Recent Past, Current & Future Analysis for Civil Engineering by Geographic Region - USA, Canada, Japan, China, Europe, Asia-Pacific and Rest of World Markets - Independent Analysis of Annual Revenues in US$ Thousand for Years 2024 through 2030 and % CAGR
  • TABLE 41: World Historic Review for Civil Engineering by Geographic Region - USA, Canada, Japan, China, Europe, Asia-Pacific and Rest of World Markets - Independent Analysis of Annual Revenues in US$ Thousand for Years 2015 through 2023 and % CAGR
  • TABLE 42: World 15-Year Perspective for Civil Engineering by Geographic Region - Percentage Breakdown of Value Revenues for USA, Canada, Japan, China, Europe, Asia-Pacific and Rest of World for Years 2015, 2025 & 2030
  • TABLE 43: World Recent Past, Current & Future Analysis for Energy by Geographic Region - USA, Canada, Japan, China, Europe, Asia-Pacific and Rest of World Markets - Independent Analysis of Annual Revenues in US$ Thousand for Years 2024 through 2030 and % CAGR
  • TABLE 44: World Historic Review for Energy by Geographic Region - USA, Canada, Japan, China, Europe, Asia-Pacific and Rest of World Markets - Independent Analysis of Annual Revenues in US$ Thousand for Years 2015 through 2023 and % CAGR
  • TABLE 45: World 15-Year Perspective for Energy by Geographic Region - Percentage Breakdown of Value Revenues for USA, Canada, Japan, China, Europe, Asia-Pacific and Rest of World for Years 2015, 2025 & 2030
  • TABLE 46: World Recent Past, Current & Future Analysis for Military & Defense by Geographic Region - USA, Canada, Japan, China, Europe, Asia-Pacific and Rest of World Markets - Independent Analysis of Annual Revenues in US$ Thousand for Years 2024 through 2030 and % CAGR
  • TABLE 47: World Historic Review for Military & Defense by Geographic Region - USA, Canada, Japan, China, Europe, Asia-Pacific and Rest of World Markets - Independent Analysis of Annual Revenues in US$ Thousand for Years 2015 through 2023 and % CAGR
  • TABLE 48: World 15-Year Perspective for Military & Defense by Geographic Region - Percentage Breakdown of Value Revenues for USA, Canada, Japan, China, Europe, Asia-Pacific and Rest of World for Years 2015, 2025 & 2030
  • TABLE 49: World Recent Past, Current & Future Analysis for Media & Entertainment by Geographic Region - USA, Canada, Japan, China, Europe, Asia-Pacific and Rest of World Markets - Independent Analysis of Annual Revenues in US$ Thousand for Years 2024 through 2030 and % CAGR
  • TABLE 50: World Historic Review for Media & Entertainment by Geographic Region - USA, Canada, Japan, China, Europe, Asia-Pacific and Rest of World Markets - Independent Analysis of Annual Revenues in US$ Thousand for Years 2015 through 2023 and % CAGR
  • TABLE 51: World 15-Year Perspective for Media & Entertainment by Geographic Region - Percentage Breakdown of Value Revenues for USA, Canada, Japan, China, Europe, Asia-Pacific and Rest of World for Years 2015, 2025 & 2030
  • TABLE 52: World Recent Past, Current & Future Analysis for Other End-Uses by Geographic Region - USA, Canada, Japan, China, Europe, Asia-Pacific and Rest of World Markets - Independent Analysis of Annual Revenues in US$ Thousand for Years 2024 through 2030 and % CAGR
  • TABLE 53: World Historic Review for Other End-Uses by Geographic Region - USA, Canada, Japan, China, Europe, Asia-Pacific and Rest of World Markets - Independent Analysis of Annual Revenues in US$ Thousand for Years 2015 through 2023 and % CAGR
  • TABLE 54: World 15-Year Perspective for Other End-Uses by Geographic Region - Percentage Breakdown of Value Revenues for USA, Canada, Japan, China, Europe, Asia-Pacific and Rest of World for Years 2015, 2025 & 2030
  • TABLE 55: World Aerial Imaging Market Analysis of Annual Sales in US$ Thousand for Years 2015 through 2030
III. MARKET ANALYSIS
UNITED STATES
  • Aerial Imaging Market Presence - Strong/Active/Niche/Trivial - Key Competitors in the United States for 2025 (E)
  • Active Players in United States
CANADA
  • Active Players in Canada
JAPAN
  • Aerial Imaging Market Presence - Strong/Active/Niche/Trivial - Key Competitors in Japan for 2025 (E)
CHINA
  • Aerial Imaging Market Presence - Strong/Active/Niche/Trivial - Key Competitors in China for 2025 (E)
EUROPE
  • Aerial Imaging Market Presence - Strong/Active/Niche/Trivial - Key Competitors in Europe for 2025 (E)
FRANCE
  • Aerial Imaging Market Presence - Strong/Active/Niche/Trivial - Key Competitors in France for 2025 (E)
GERMANY
  • Aerial Imaging Market Presence - Strong/Active/Niche/Trivial - Key Competitors in Germany for 2025 (E)
ITALY
UNITED KINGDOM
  • Aerial Imaging Market Presence - Strong/Active/Niche/Trivial - Key Competitors in the United Kingdom for 2025 (E)
  • Active Players in United Kingdom
REST OF EUROPE
ASIA-PACIFIC
  • Aerial Imaging Market Presence - Strong/Active/Niche/Trivial - Key Competitors in Asia-Pacific for 2025 (E)
REST OF WORLDIV. COMPETITION

Companies Mentioned (Partial List)

A selection of companies mentioned in this report includes, but is not limited to:

  • AeroVironment, Inc.
  • 3D Robotics, Inc. (3DR)
  • Altispire
  • CYBERHAWK Innovations Ltd.
  • DroneDeploy
  • Fugro NV
  • Bluesky International Ltd.
  • DroneView Technologies
  • Datumate Ltd.
  • FlyWorx - Aerial Drone Services
  • AEROmetrex
  • Ceres Imaging
  • Drone Aerial Imaging
  • GroundTruth Exploration Inc.
  • Airobotics Ltd.

Table Information